Market Volatility in Perspective
InvestmentMarket Volatility
Recent headlines have heightened concerns about market volatility, particularly as conditions in the Middle East evolve. Many investors are questioning whether portfolio changes are necessary. While such reactions can feel unsettling, they are a normal feature of investing. Periodic market reactions to headlines are expected and part of the investment landscape.
There will always be reasons for concern, but markets have historically adapted to an ongoing stream of uncertainties. While past performance does not predict future outcomes, understanding historical patterns can provide valuable perspective during periods of uncertainty.
Historical perspective
On the last Friday in February, the CBOE Volatility Index (VIX) closed at 19.9 very near its daily average since 1990. The VIX is a popular barometer of the market’s expectations of near-term volatility for U.S stocks. Higher VIX levels indicate higher short-term volatility expectations and a higher cost for insurance against market downturns.
Given the conflict in Iran that began on February 28 and the ensuing market and economic uncertainty, it should come as no surprise that the VIX has reached higher levels on several occasions over the last month. An intra-day high of 35.3 occurred on March 9 — 78% above the February closing level — and the VIX closed above 30 as recently as March 30 before dropping to 25.3 to end the month.
Higher volatility is a reality for investors today, and uncertainty remains about the potential carry-on effects as the conflict in the Middle East continues. However, context is key.
It’s normal for investors to place a higher weight in their minds on what’s happened recently versus what’s occurred in the past. A useful tactic for overcoming this potential psychological bias is to step back and consider today’s events in the broader context.
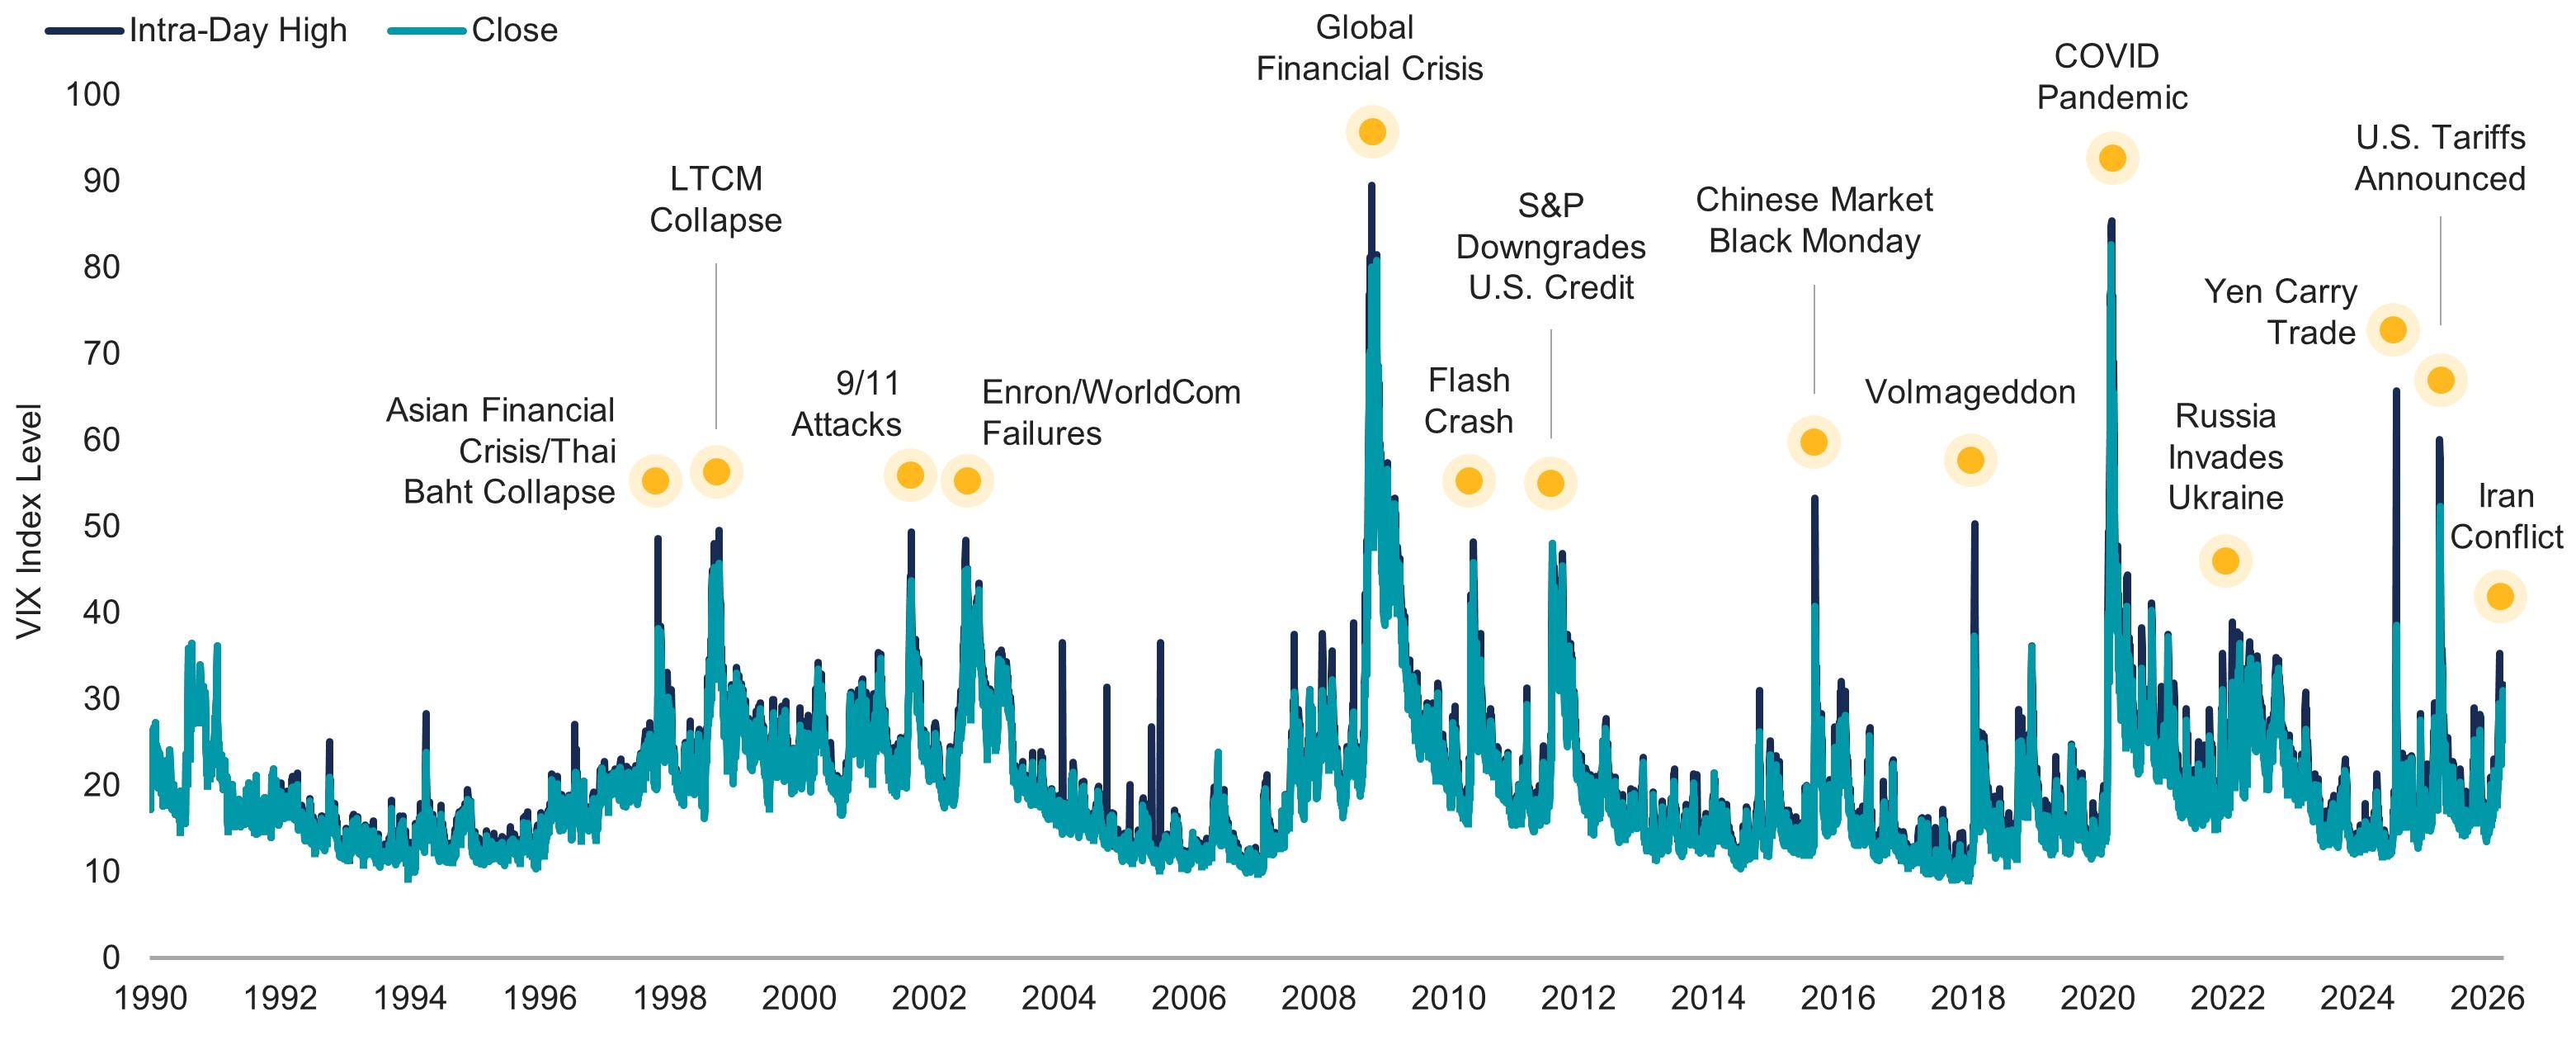
Let’s consider where the VIX stands today versus history. Figure 1 shows the daily VIX closing and intra-day highs from the start of 1990 through March 2026. The recent rise is evident in the chart, but we also observe many past instances when the VIX reached levels far higher than today. In fact, while the recent volatility should not be glossed over, there are several hundred days since 1990 when the VIX surpassed the March 2026 high of 35.3.
Remarkably, since the start of 2020, expected volatility has risen above recent levels on several occasions, including around the COVID-19 pandemic in 2020, the Russian invasion of Ukraine in 2022, the unwinding of the Yen carry trade in 2024, and U.S. tariff announcements in 2025.
Figure 1 | Volatility Has Risen but Remains Far Below Many Periods in the Past
VIX Index Levels Since 1990
 Source: CBOE. Data from 1/1/1990 – 3/31/2026. The VIX Index tracks the expected 30-day future volatility of the S&P 500 Index.
Of course, the VIX is not the only measure garnering attention today. The direction of oil prices, inflation, interest rates, economic growth and more are routinely in the headlines. How do those stack up versus the past?
In Figure 2, we show a broad set of common market and macroeconomic measures, highlighting the latest data versus the highs and lows for each since the start of 2020. As seen previously in the VIX data, the range across the metrics shown has been significant. Current levels remain within the bounds investors have observed in only the past several years.
Even oil and gasoline prices (Panel A), which have elevated meaningfully over the past month, have thus far held below levels reached in 2022 after the Russian invasion of Ukraine, which was followed by severe sanctions on Russian oil. And, while Federal Reserve forecasts of March CPI are higher than prior prints (3.25%), that’s still considerably lower than the highs from 2022. The Fed’s latest forecast of first-quarter GDP growth also remains stable at 1.6%.
Figure 2 | Investors Have Faced a Wide Range of Headline Data Since 2020
PANEL A: Macroeconomic and Commodity Price Metrics
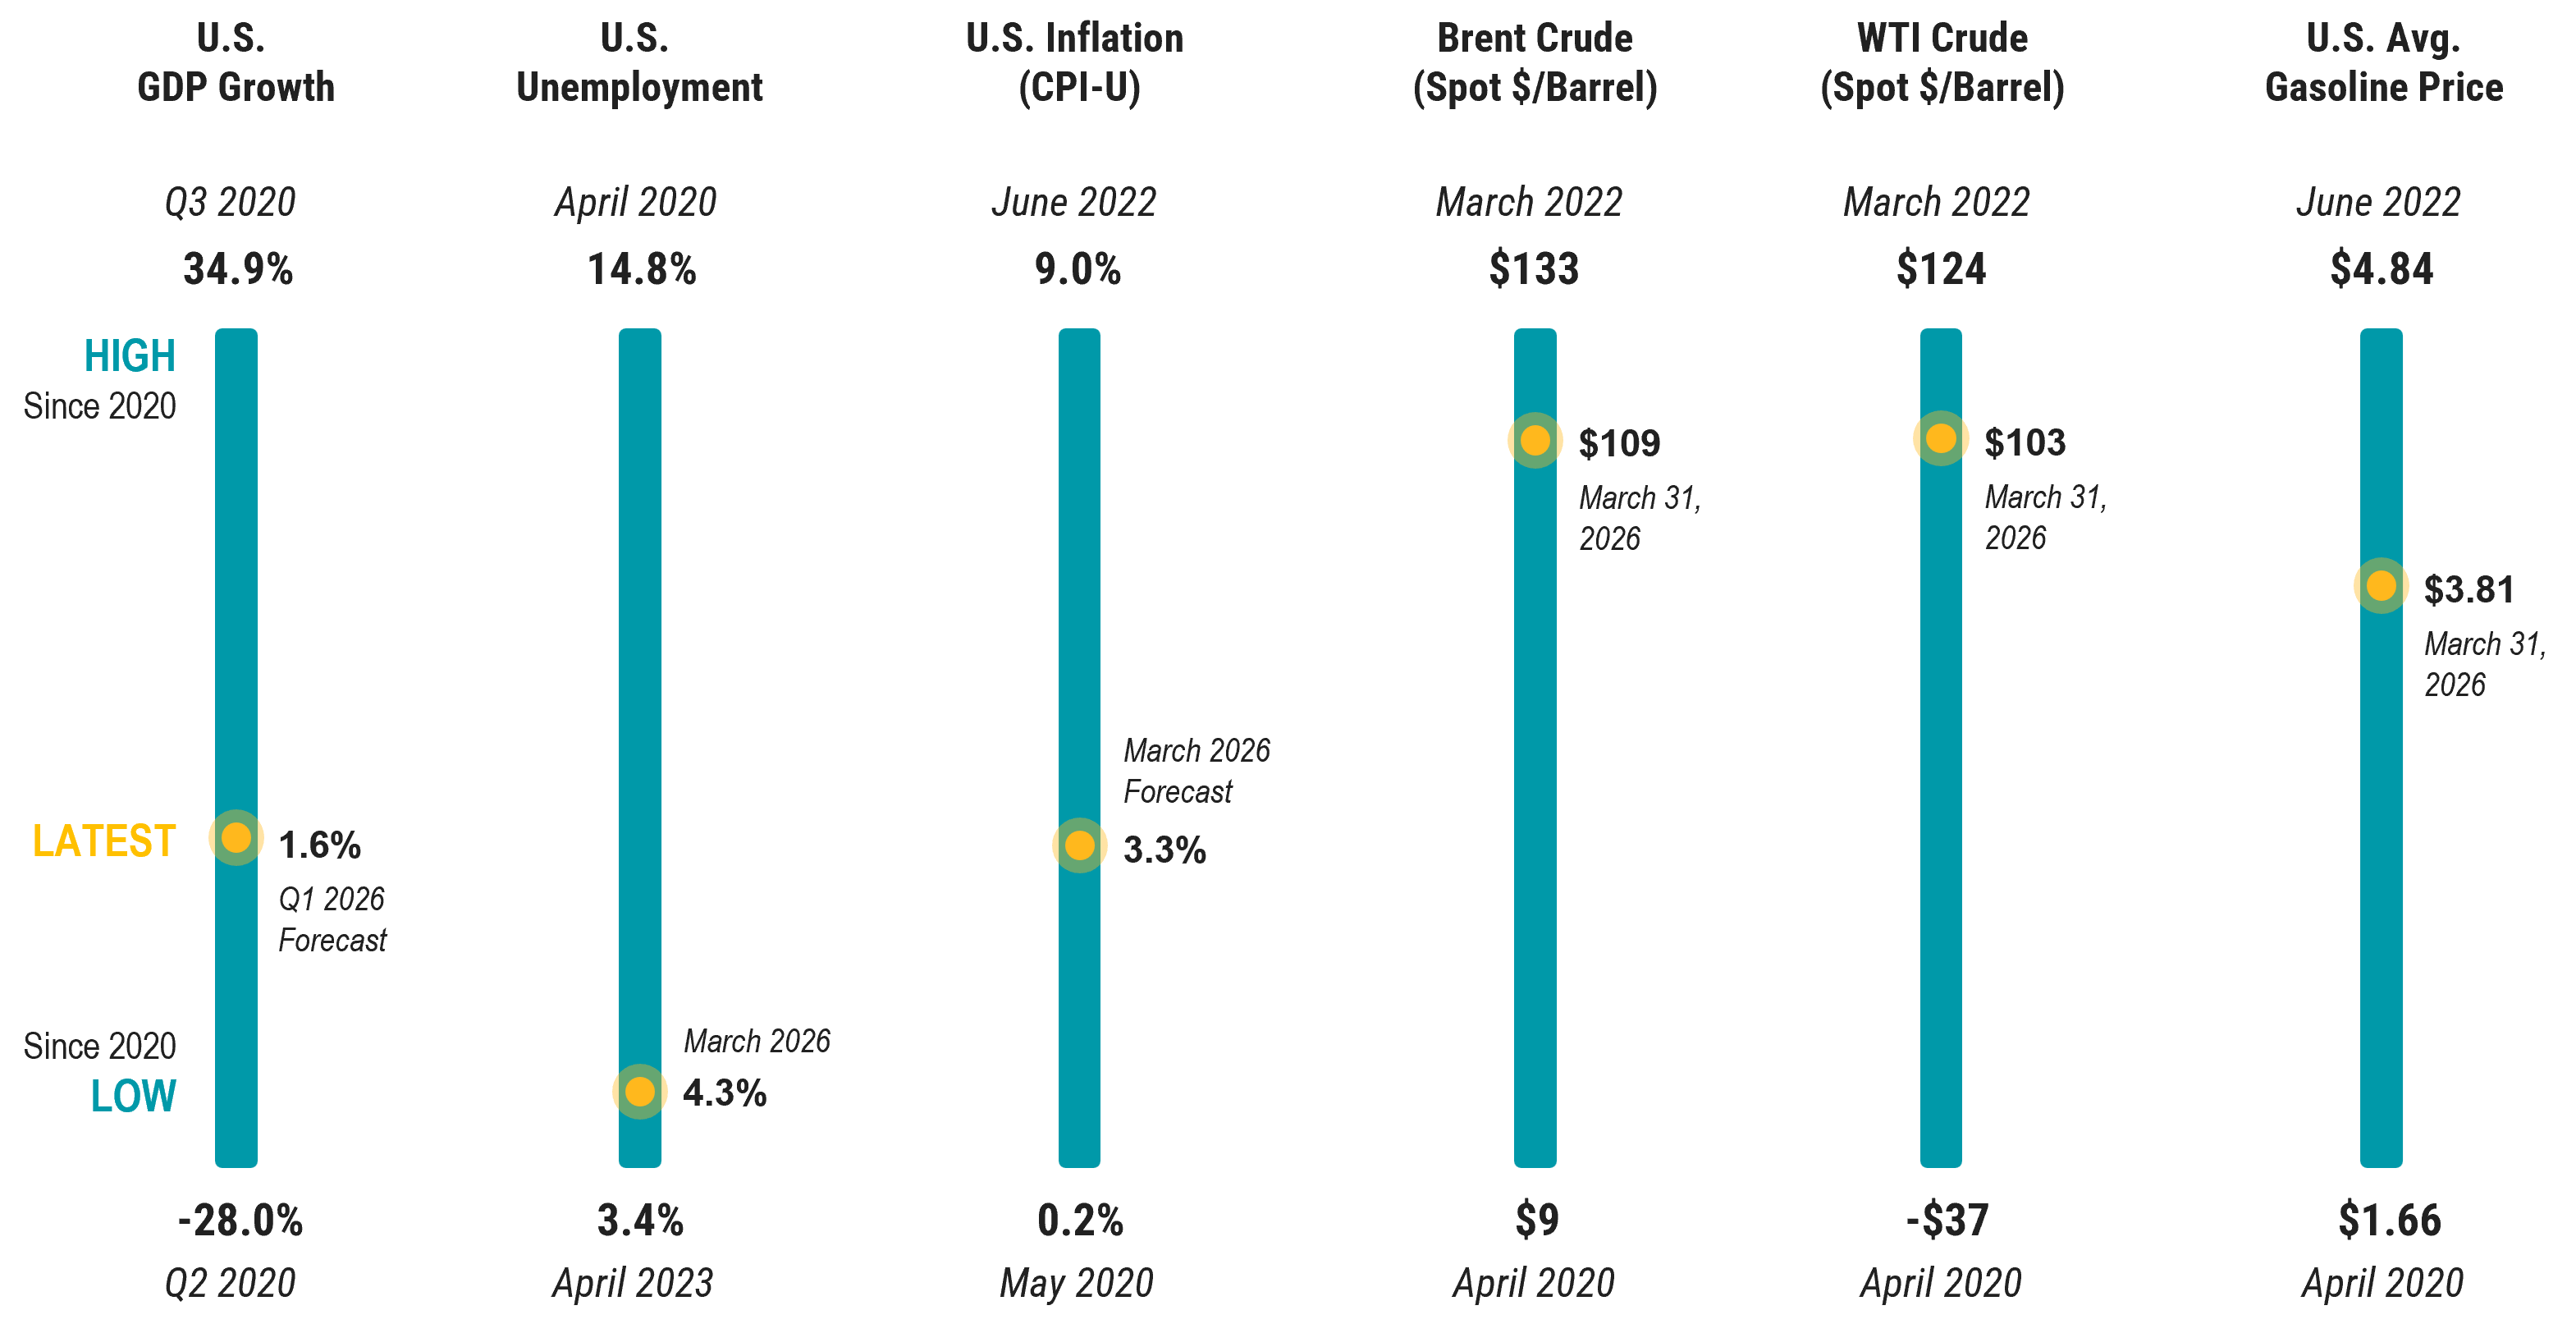 Source: Data from 1/1/2020– 3/31/2026. GDP Source: U.S. Bureau of Economic Analysis (BEA) and the Federal Reserve Bank of Atlanta’s GDPNow. U.S. Unemployment Source: U.S. Bureau of Labor Statistics (BLS). U.S. Inflation Source: U.S. Bureau of Labor Statistics (BLS) and the Federal Reserve Bank of Cleveland’s Inflation Nowcasting. Brent Crude, WTI Crude, and U.S. Average Gasoline Price Source: U.S. Energy Information Administration (EIA).
Figure 2 | Investors Have Faced a Wide Range of Headline Data Since 2020
PANEL B: Market Metrics
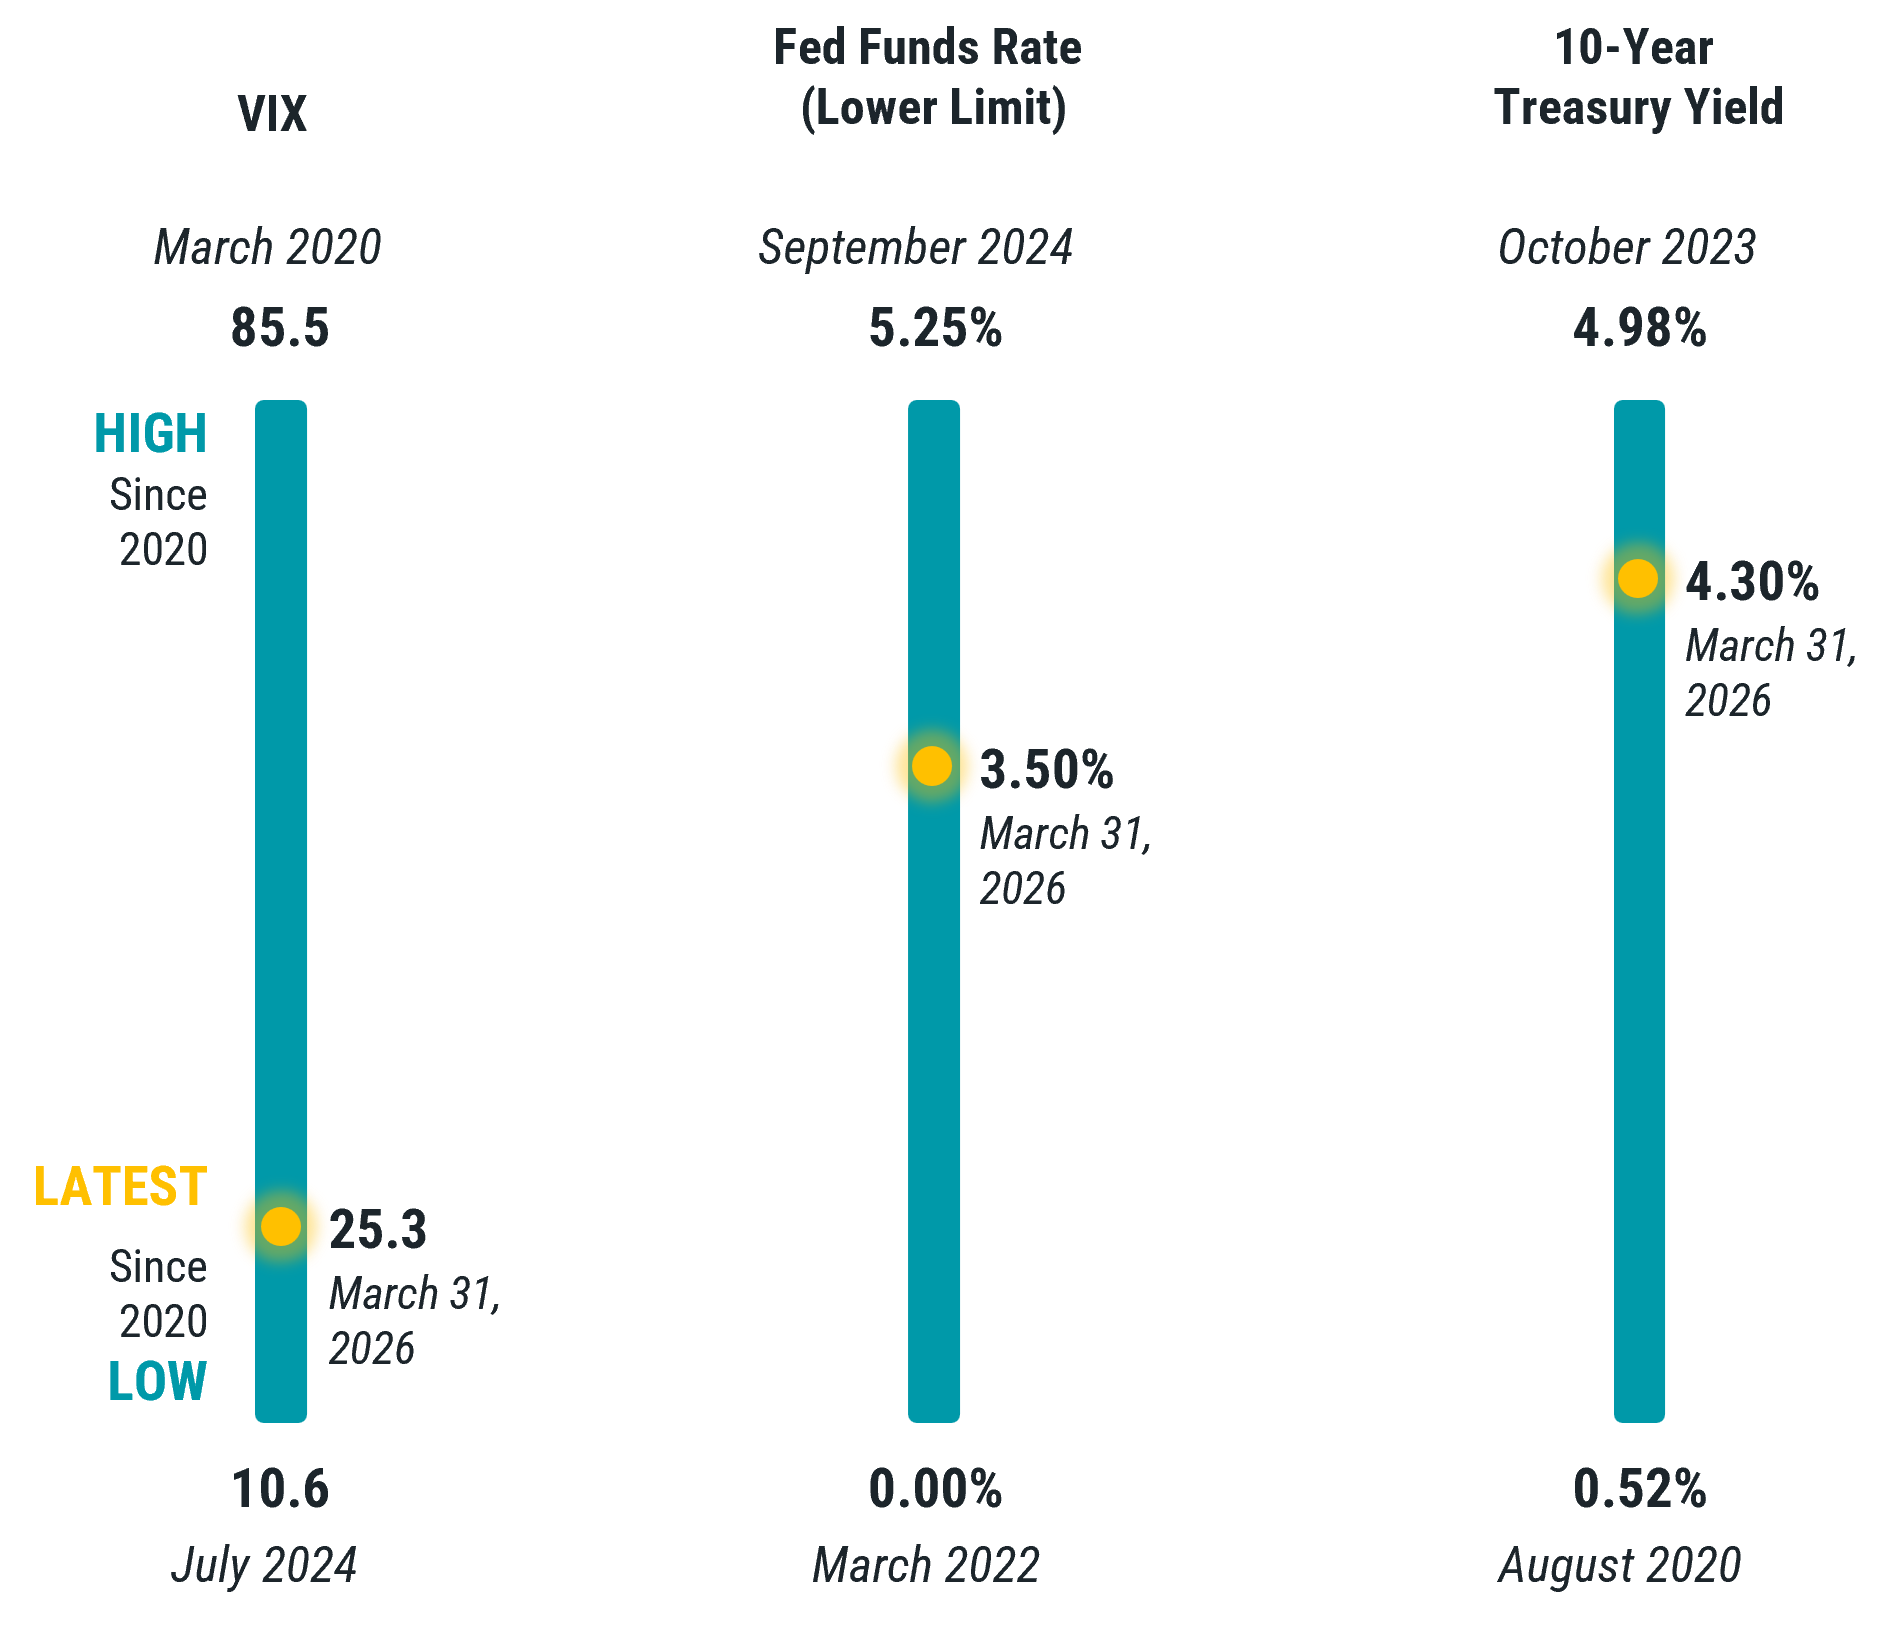 Source: Data from 1/1/2020– 3/31/2026. VIX Source: Cboe. Fed Funds Rate and 10-Year Treasury Yield Source: Federal Reserve Bank of St. Louis (FRED)
Importantly, despite the dramatic highs and lows in the headline data investors considered over this period, global stock markets have delivered meaningful growth.
There were sizable drawdowns across global markets in early 2020, throughout much of 2022 and in early 2025. For context, the S&P 500 was down 5% in March 2026. It declined more than 20% in March 2020 and about 20% in each of 2022 and 2025. Yet, as shown in Figure 3, the S&P 500 Index is up about 122% (cumulative) since the start of 2020, and global stocks also gained nearly 90% in USD.
Figure 3
Periods of Heightened Volatility Since 2020 Have Not Prevented Growth from Global Stocks
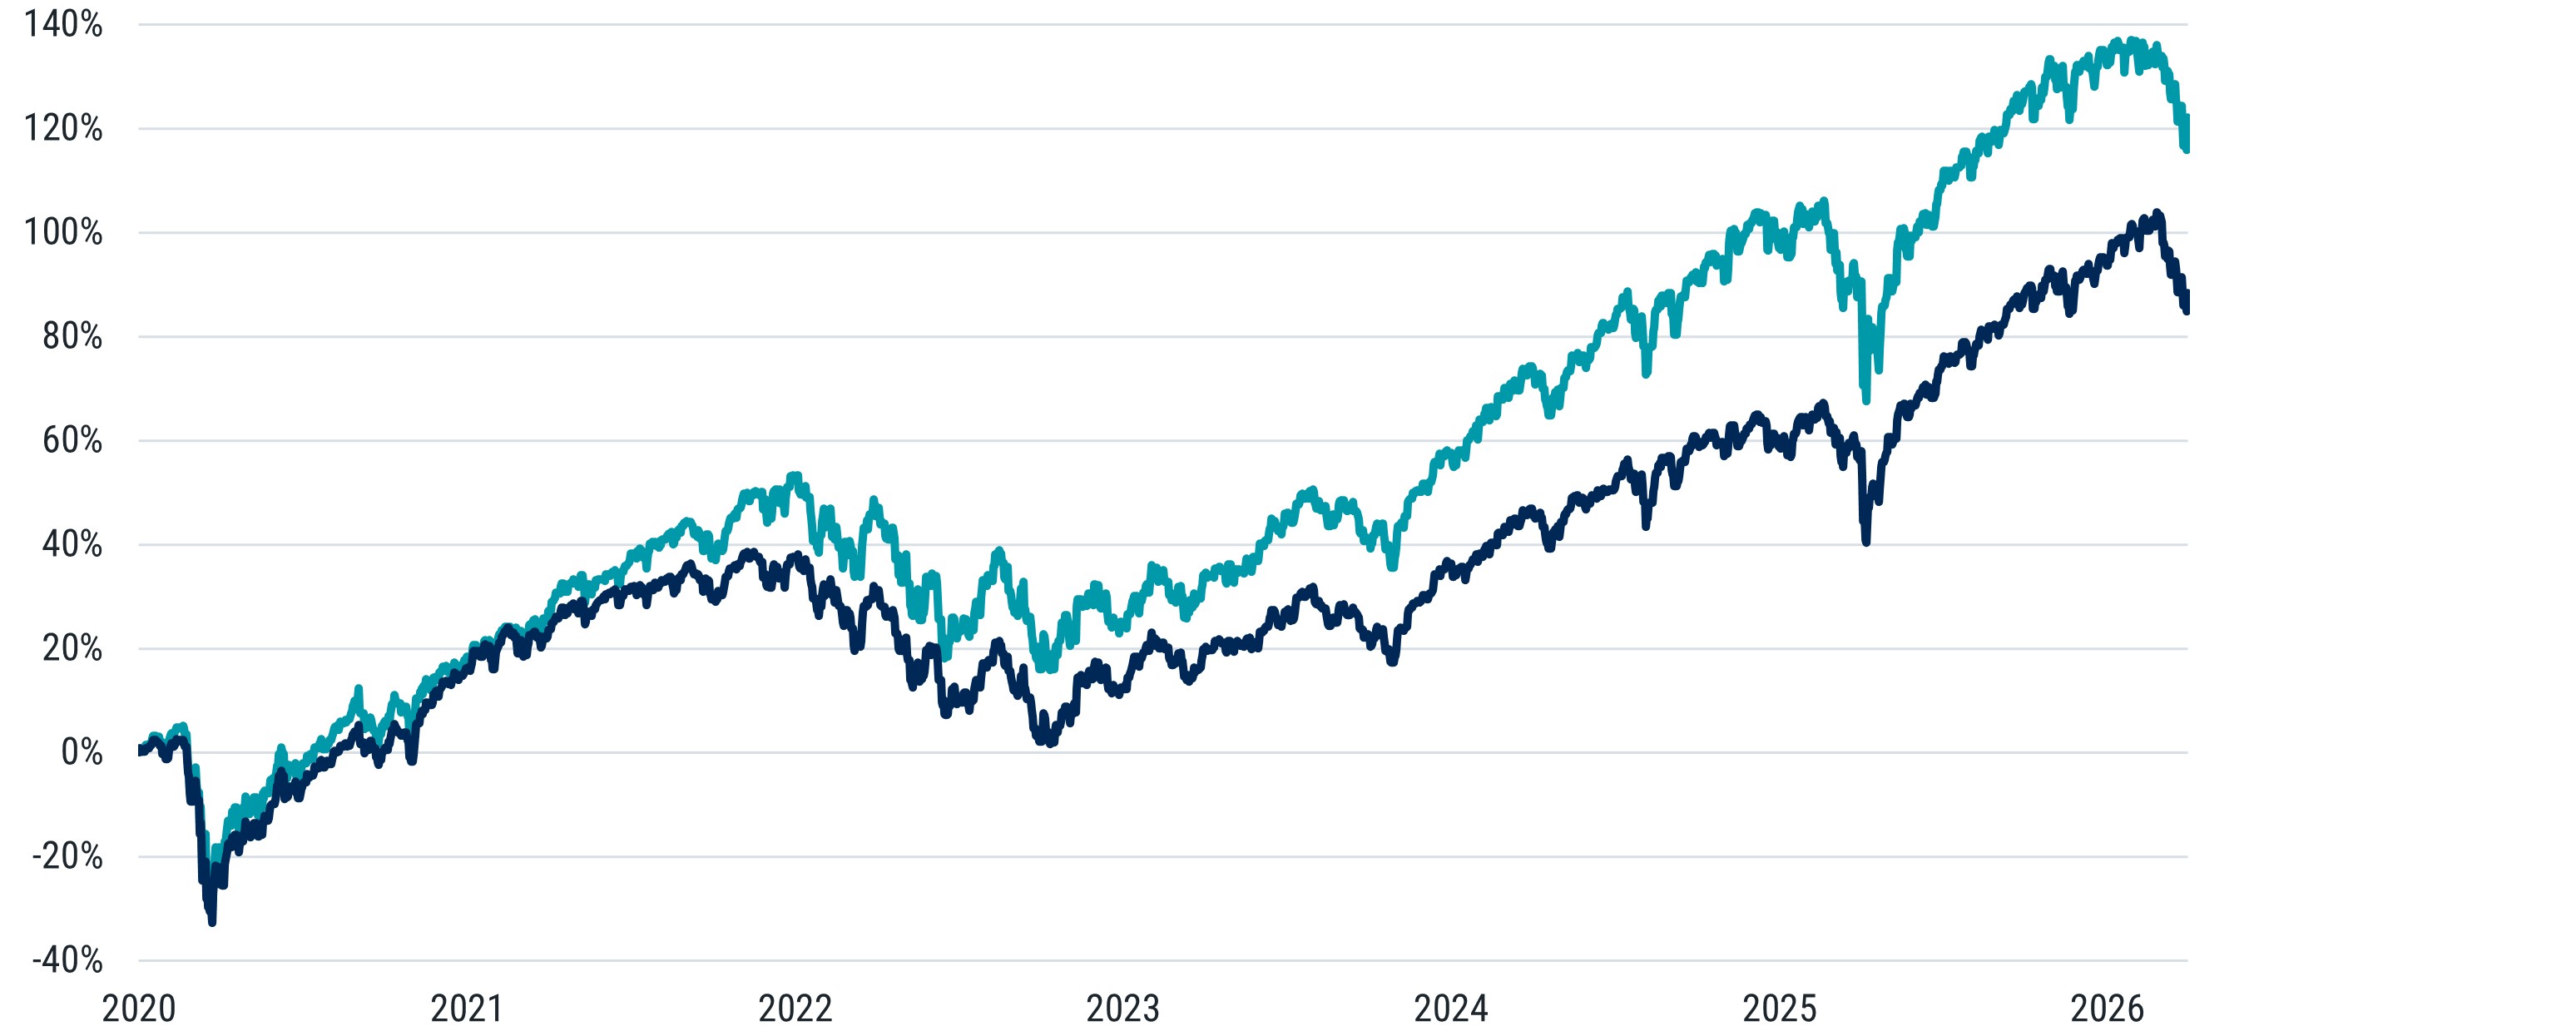
S&P 500 MSCI ACWI IMI
Cumulative 122.2% 88.4%
Compound 13.6% 10.7%
Source: Morningstar. Data from 1/1/2020 – 3/31/2026. Past performance is no guarantee of future results.
In Summary
While uncertainty remains high and near‑term outcomes are unknowable, today’s market conditions are not unprecedented. We believe investors can benefit from remembering that a headline about a single measure, such as oil prices spiking or inflation estimates “rattling” markets, is always better with more context.
While each market downturn will have its own unique characteristics, investors may find comfort in knowing that many of the oft-cited measures have not reached recent past extremes. Importantly, those extremes are periods investors have recently faced, and for those who endured, global stock markets have delivered strong results.
Viewing current events in historical context can help investors avoid overreacting to headlines and remain focused on long‑term objectives.